
Supplementary Files
How to Cite
Downloads
Most read articles by the same author(s)
- Óscar Adrián Guzmán-Piedrahita, Jairo Castaño-Zapata, RECOGNITION OF PHYTOPATHOGENIC NEMATODES IN DOMINICO "HARTON" PLANTAINS (MUSA AAB SIMMONDS) AFRICA, FHIA- 20 AND FH IA-21 IN THE MONTELINDO PLANTATION, PALESTINA TOWNSHIP (CALDAS), COLOMBIA , Revista de la Academia Colombiana de Ciencias Exactas, Físicas y Naturales: Vol. 28 No. 107 (2004)
- Oscar Iván Molina-Tirado, Jairo Castaño-Zapata, ANALYSIS OF SOME COMPONENTS OF RESISTANCE IN THE HYBRIDS OF BANANA AND PLANTAIN FHIA 01, FHIA 17 AND FHIA 21 TO BLACK SIGATOKA (MYCOSPHAERELLA FIJIENSIS) AND YELLOW SIGATOKA (M. MUSICOLA) , Revista de la Academia Colombiana de Ciencias Exactas, Físicas y Naturales: Vol. 27 No. 103 (2003)
- Catalina Quintero-Vargas, Jairo Castaño-Zapata, EVALUATION OF INDUCTORS OF RESISTANCE TO MANAGE PLANT PARASITIC NEMATODES IN SEEDLINGS OF PLANTAIN , Revista de la Academia Colombiana de Ciencias Exactas, Físicas y Naturales: Vol. 36 No. 141 (2012)
- Rocío Alexandra Ortiz-Paz, Carolina González-Cardona, Jairo Castaño-Zapata, ETIOLOGY OF ONION (ALLIUM FISTULOSUM L.) WHITE TIP AT THE FARM TESORITO, MANIZALES-CALDAS , Revista de la Academia Colombiana de Ciencias Exactas, Físicas y Naturales: Vol. 36 No. 140 (2012)
- Claudia Milena Quiroz-Ojeda, María José Botero-Ospina, Jairo Castaño-Zapata, ETIOLOGY OF THE NECROSIS OF THE TERMINAL BUDS OF CASTOR (RICINUS COMMUNIS L.) , Revista de la Academia Colombiana de Ciencias Exactas, Físicas y Naturales: Vol. 35 No. 135 (2011)
- Mayary Torrado-Jaime, Jairo Castaño-Zapata, FRECUENCY OF BLACK AND YELLOW SIGATOKAS ON PLANTAIN (MUSA SPP.) ACCORDING TO THE DEVELOPMENT STAGES OF THE PLANT , Revista de la Academia Colombiana de Ciencias Exactas, Físicas y Naturales: Vol. 32 No. 125 (2008)


Métricas Alternativas
Dimensions
Abstract
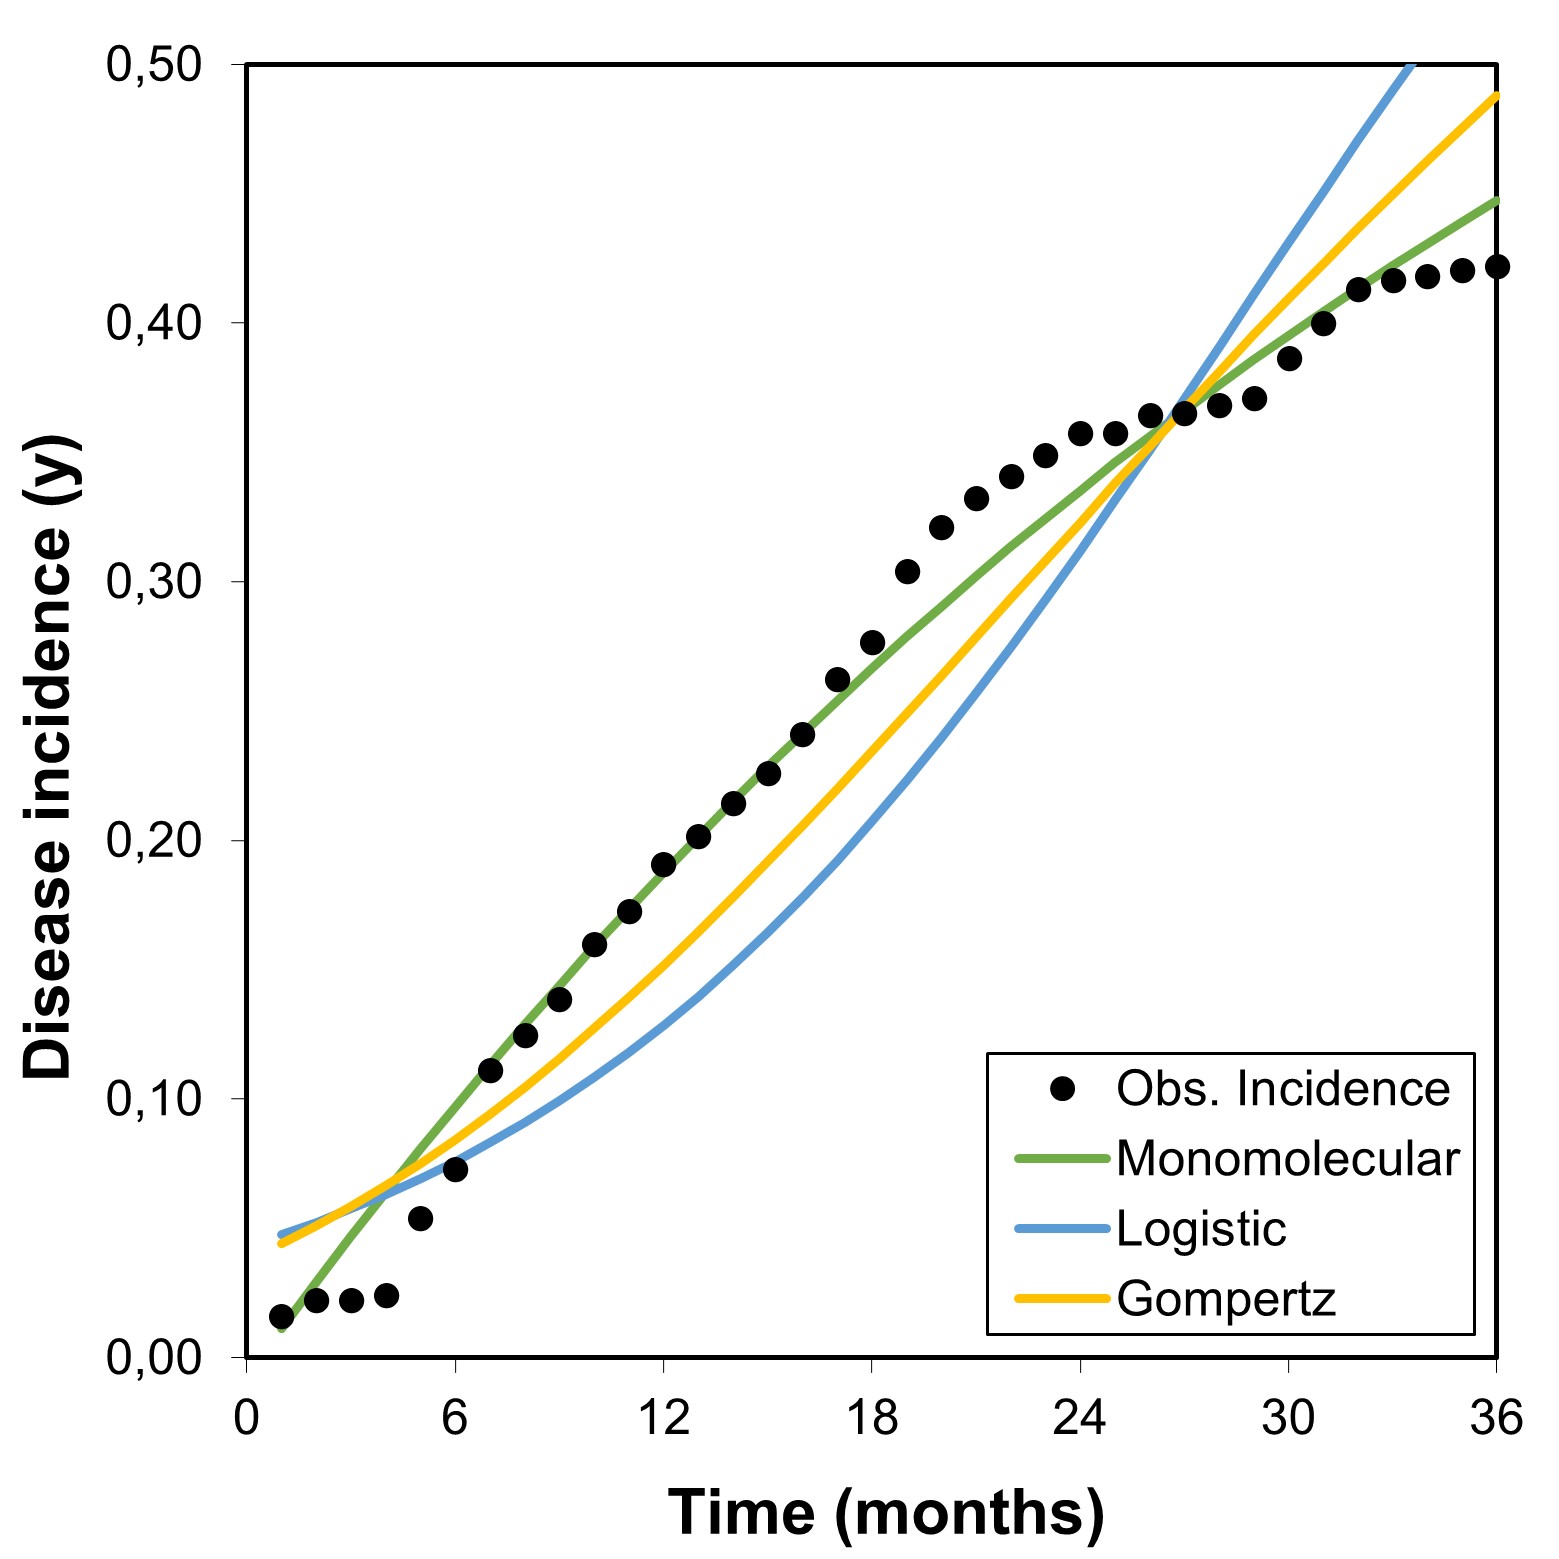
The production of oil palm is a major agricultural activity in Colombia. Lethal wilt (LW) of the oil palm is one of the most devastating diseases in the Eastern zone of the country. Several epidemiological models used in epidemic analyses assume that there is a constant area where the host will become diseased at the end of the epidemic (maximum incidence of disease = 100%). Based on the analysis of three different epidemics, we demonstrated the error in the application of the model that best fits the observed data when the maximum incidence of the disease (Kmax) is below the assumed. We assessed the fit of the monomolecular, logistic, and Gompertz models at different final incidence values of the disease including the maximum observed (y1 + 0.1). We analyzed the data with linear regression and residuals variance and distribution. We measured the relative quality level of fit of the model for each Kmax by determining coefficients (R2) and the Akaike and Bayesian information criteria (AIC & BIC). The monomolecular model showed a tendency to increase the level of adjustment when Kmax assumed values were close to 1 while the logistic and Gompertz models remained stable regardless of the evaluated Kmax values. The consequences of assuming a Kmax with values equal to 1 reflected not only the erroneous estimation of parameters such as y0 and r but also gave rise to a misinterpretation of the temporal behavior of the epidemic.
Keywords
References
Analytis, S. (1973). Zur methodik der analyse von epidemien dargestellt am apfelschorf (Venturia inaequalis (Cooke) Aderh.). Acta Phytomed. 1: 1-75.
Analytis, S. (1979). Die transformation von befallswerten in der quantitativen phytopathologie. Phytopathol. Z. 96: 156-171.
Alves, K.S. & Del Ponte, E.M. (2021). Analysis and simulation of plant disease progress curves in R: introducing the epifitter package. Phytopathol. Res. 3: 22. 13 p.
Arneson, P.A. (2001). Plant disease epidemiology: temporal aspects. The Plant Health Instructor. Accessed on: November 19, 2021. Retrieved from: https://www.apsnet.org/edcenter/disimpactmngmnt/topc/EpidemiologyTemporal/Pages/default.aspx
Bowen K. L. (2015). Models of disease progress, pp. 9-15. In: Stevenson KL, Jeger MJ, editors. Exercises in Plant Disease Epidemiology, 2nd ed. The American Phytopathological Society (APS Press). St Paul.
Burnham, K. P. & Anderson, D. (2002). Model selection and multimodal interference. 2nd ed. Springer-Verlag, New York. 23 pp.
Campbell, C. L. (1998). Disease progress in time: modelling and data analysis, pp. 181-206. In: D. Gareth Jones (ed.), The epidemiology of plant disease. Kluwer Publishers, Dordrecht.
Campbell, C. L. & Madden, L.V. (1990). Introduction to plant disease epidemiology. Wiley, New York. 532 pp.
Forrest, F. W. (2007). The role of plant disease epidemiology in developing successful integrated disease management programs, pp. 45-79. In: A. Ciancio and K. G. Mukerji (eds.), General Concepts in Integrated Pest and Disease Management. vol. 1, Springer, Dordrecht, The Netherlands.
Gigot, C. (2018). Epiphy: analysis of plant disease epidemics. Accessed on: November 19, 2021. Retrieved from: https://CRAN.R-project.org/package=epiphy
Gilligan, C. A. (1990). Comparison of disease progress curves. New Phytol. 115 (2): 223-242.
Hosmer, D. W. & Lemeshow, S. (2000). Applied logistic regression, 2nd ed. John Wiley & Sons, Inc. 392 pp.
ICA. (2014). Resolución ICA 004170: Por medio de la cual se declaran las plagas de control oficial en el cultivo de palma de aceite en el territorio nacional y se establecen las medidas fitosanitarias para su manejo y control. Accessed on: November 19, 2021. Retrieved from: https://www.ica.gov.co/getattachment/0e5ecaac-ccb6-444f-96bb-3d488048b51f/2014R4170.aspx
Jeger, M. J. (1982). Using growth curve relative rates to model disease progress of apple powdery mildew. Prot. Ecol. 4: 49-58.
Kiyosawa, S. (1972). Mathematical studies on the curve of disease increase. Ann. Phytopathol. Soc. Jpn. 38: 30-40.
Kushalappa, A. C. & Ludwing, A. (1982). Calculation of apparent infection rate in plant disease: Development of a method to correct for host growth. Phytopathology. 72: 1373-1377.
Kranz, J. (2003). Comparison of temporal aspects of epidemics: the disease progress curves, pp 93-133. In: Comparative Epidemiology of Plant Diseases. Springer, Berlin, Heidelberg.
López-Vásquez, J. M., Mesa-Fuquen, E., Acosta, M. C. Tovar, J. P. (2021). Descripción del comportamiento de la enfermedad marchitez letal de la palma de aceite a partir del análisis epidemiológico temporal. Revista Palmas. 42 (2): 69-80.
Madden, L. V. (1986). Statistical analysis and comparison of disease progress curves, pp. 55-84. In: K. Leonard and W. E. Fry, (eds.), Plant Disease Epidemiology. Macmillan Publishing Co.,New York.
Madden, L. V., Hughes, G., van den Bosch, F. (2007). The study of plant disease epidemics. APS Press, St. Paul, MN. 421 pp.
Mazerolle, M. J. (2019). AICcmodavg: model selection and multimodel inference based on (Q) AIC(c). R package version 2.2-2. The R Foundation for Statistical Computing, Vienna, Austria.
McCullagh, P. & Nelder, J. A. (1992). Generalized linear model. Chapman & Hall. London. 526 pp.
Neher, D. & Campbell, C. L. (1992). Underestimation of disease progress rates with the Logistic, Monomolecular, and Gompertz models when maximum disease intensity is less than 100 percent. Phytopathology. 82 (8): 811-814.
Neher, D. A., Reynolds, K. L. Campbell, C.L. (1997). Analysis of disease progress curves using linear models. Chapter 7. In: L. J. Francl and D. A. Neher (eds.), Exercises in Plant Disease Epidemiology. APS Press. St. Paul, Minnesota. 242 pp.
Nutter, F. W., Eggenberger, S. K., Littlejohn, K. J. (2017). Visualizing, describing, and modeling disease progress curves using Epimodel, pp 21-30. In: Stevenson KL, Jeger MJ, editors. Exercises in Plant Disease Epidemiology, 2nd ed. The American Phytopathological Society (APS Press). St Paul. 276 pp.
Park, E. W. & Lim, S. M. (1985). Empirical estimation of the asymptotes of disease progress curves and the use of the Richards generalized rate parameters for describing disease progress. Phytopathology. 75: 786-791.
Pinheiro, J. C., Bates, D., DebRoy, S., Sarkar, D. (2004). nlme: linear and nonlinear mixed effects models. R package version 3: 1-52. The R Foundation for Statistical Computing, Vienna, Austria.
R Core Team. (2018). R: A language and environment for statistical computing. R Foundation for Statistical Computing, Vienna, Austria.
Rocha, P. J., Tovar, J. P., Gutiérrez, D. F., Mosquera, M. (2007). Marchitez letal en palma de aceite. Boletín Técnico N°22. Bogotá, Colombia.
Seem, R. C. (1988). Measurement and analysis of the effects of crop development on epidemics, pp. 51-68. In: J. Kranz and J. Rotem, (eds.), Experimental Techniques in Plant Disease Epidemiology. Springer-Verlag, Berlin. 317 pp.
Turner, M. G., Blumenstein, B. A., Sebaugh, J. L. (1969). A generalization of the logistic law of growth. Biometrics. 25: 557-580.
Van Maanen, A. & Xu X. (2003). Modelling plant disease epidemics. Europ. J. Plant. Pathol. 109 (7): 669-682.
Van der Plank, J. E. (1963). Plant disease: epidemics and control. Academic Press, New York, USA. 349 pp.
Xu, X. (2006). Modelling and interpreting disease progress in time, pp. 215-238. In: Cooke, B. M., Gareth Jones, D., and Kaye, B. (eds.) The Epidemiology of Plant Disease. Springer, Dordrecht, The Netherlands. 576 pp.

This work is licensed under a Creative Commons Attribution-NonCommercial-NoDerivatives 4.0 International License.
Copyright (c) 2021 Revista de la Academia Colombiana de Ciencias Exactas, Físicas y Naturales